Products / A sports analytics platform
Give coaches a clearer path through the information.
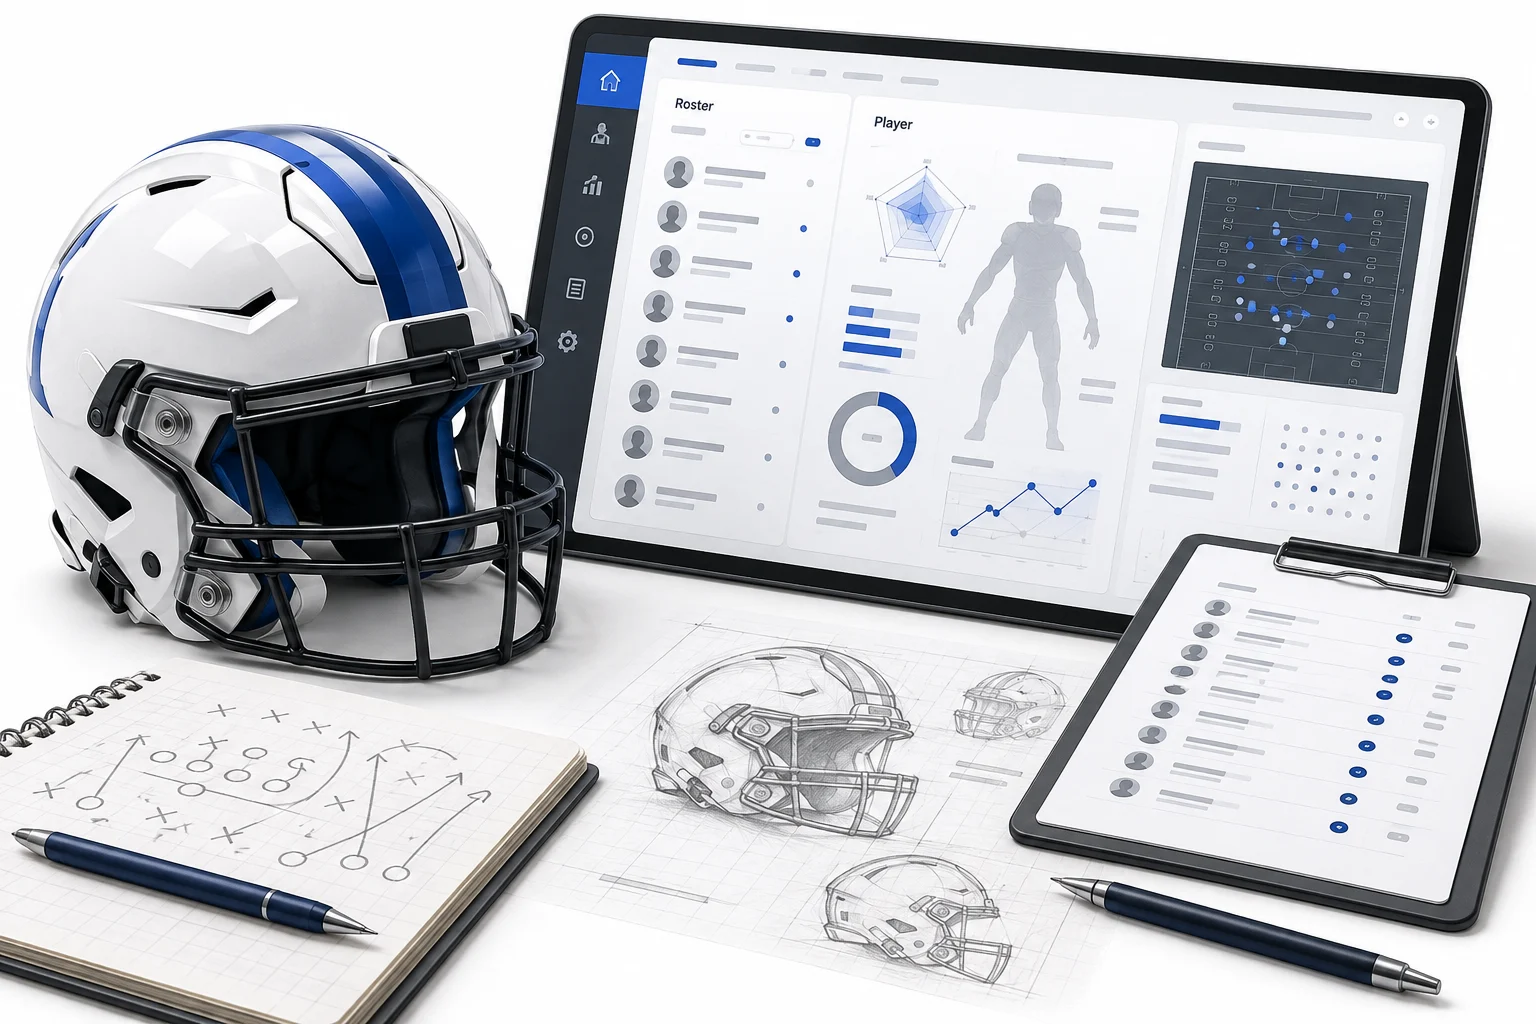
Responsive interface design for team, roster, player, and reporting experiences.
User questions
Information hierarchy
Report experience
Administration views
Separate the questions people are asking.
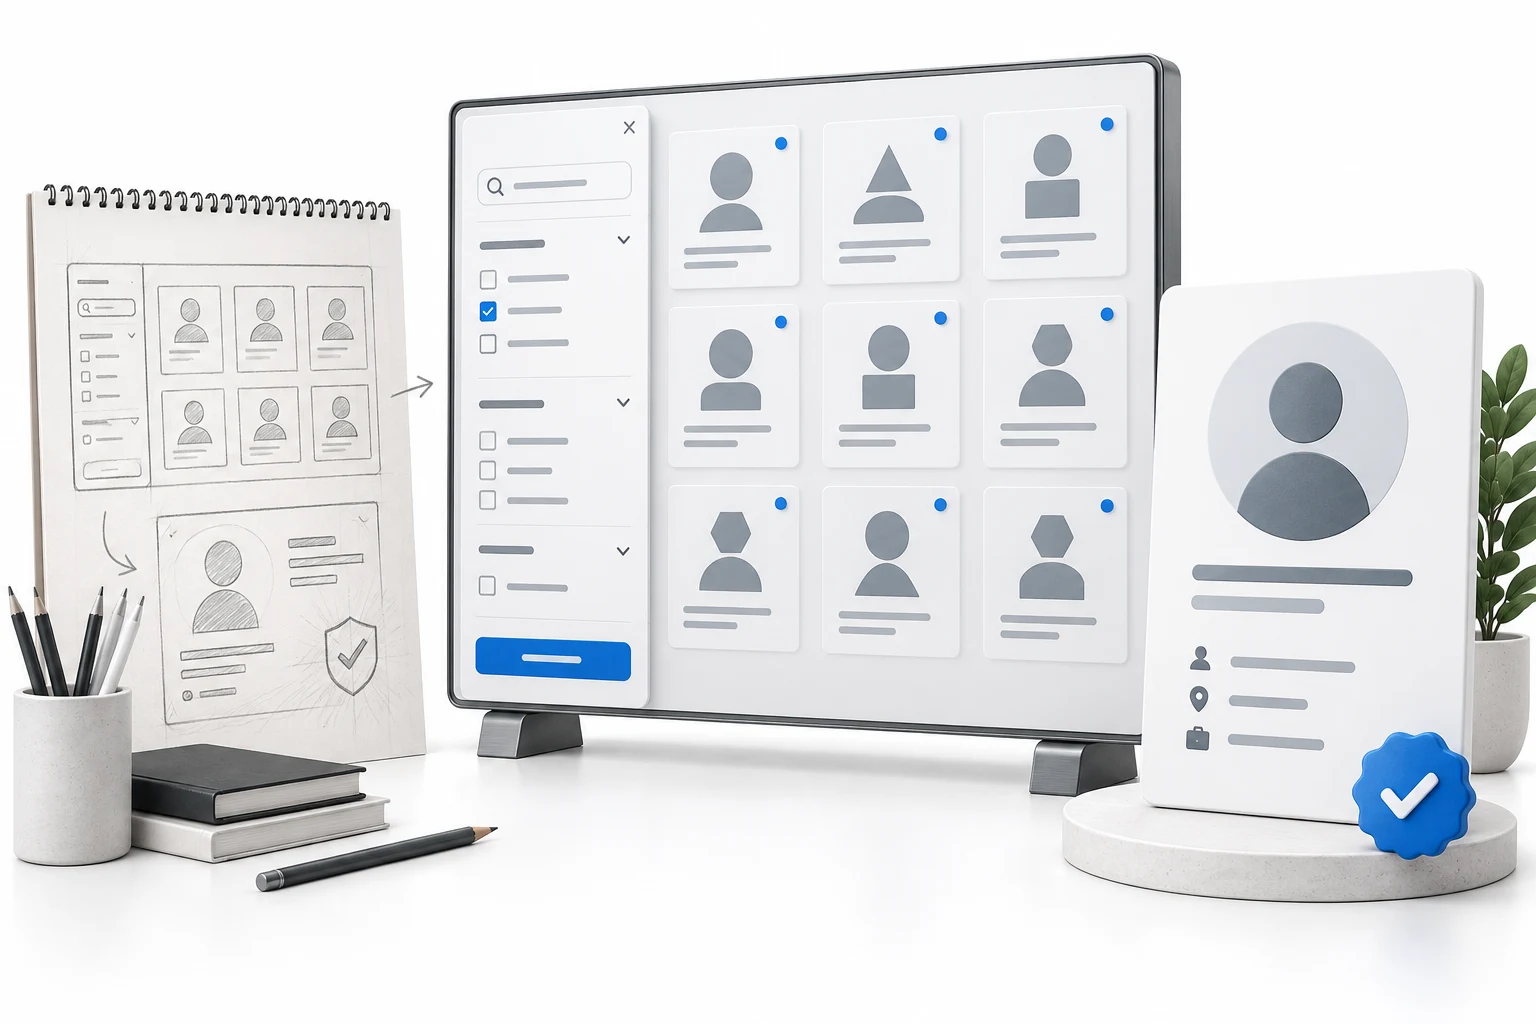
A team view, a roster comparison, and an individual player report serve different purposes. I worked on organizing these experiences so the navigation and page structure reflected those differences rather than crowding every option into the same screen.
Connect the interface to the report.
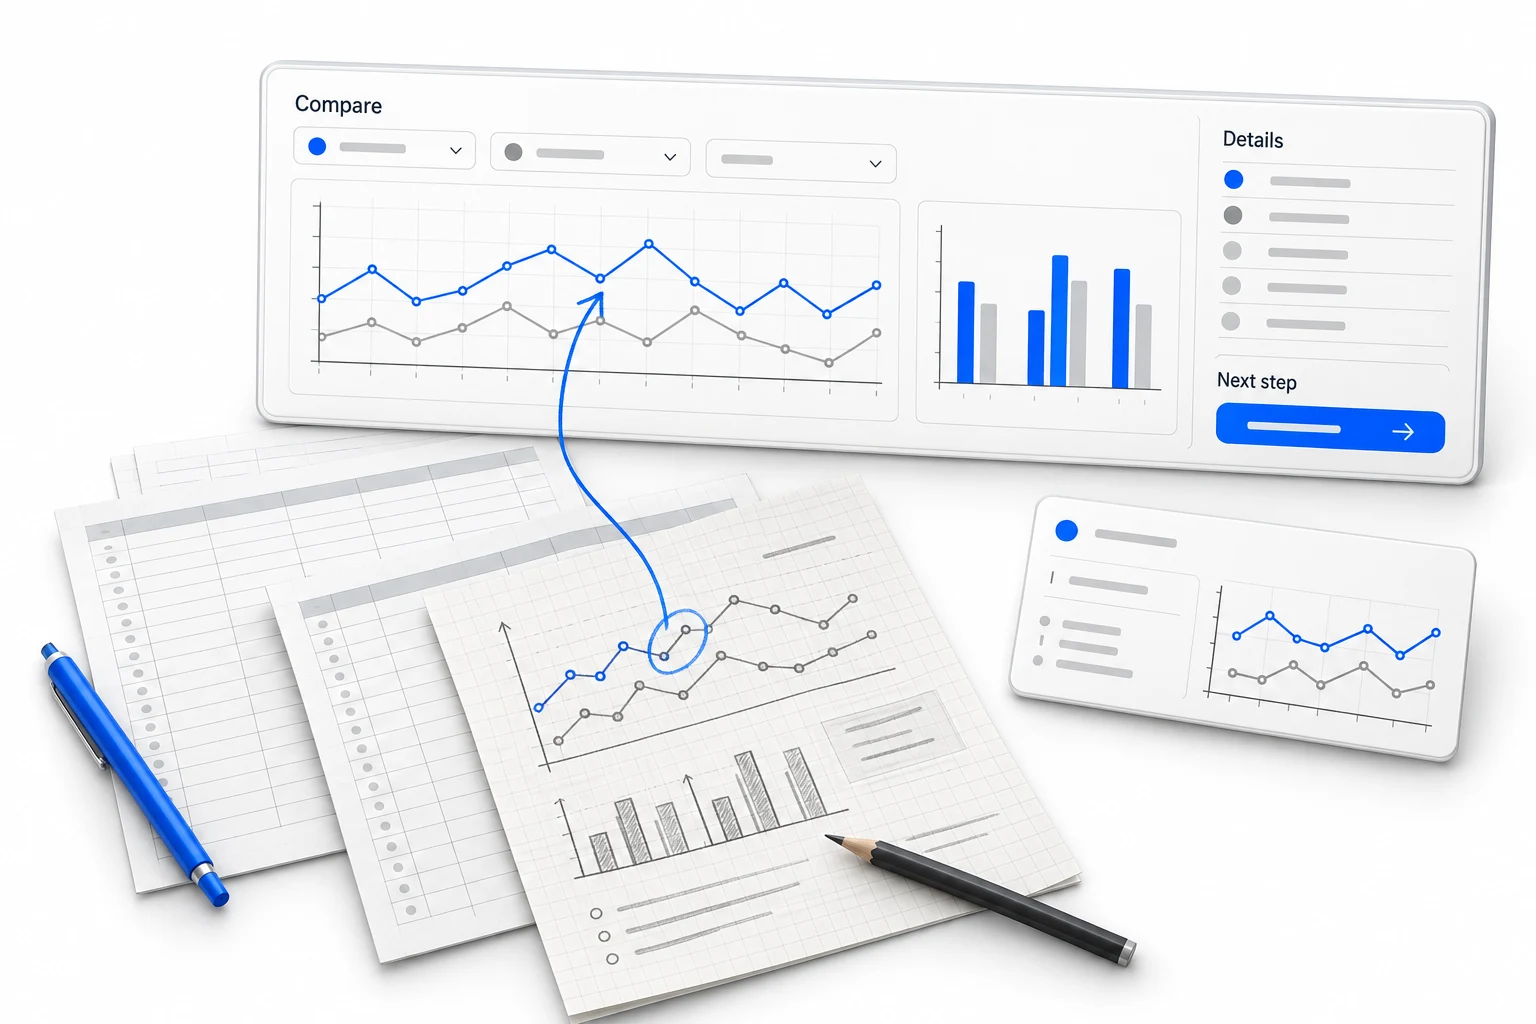
The designs accounted for daily and weekly views, date selection, position and player filters, report selection, and embedded Power BI content. Design notes separated interface decisions from the filtering and data behavior the development team needed to implement.
Keep administration part of the experience.
The wider work included mobile wireframes and organization and team editing. Account preferences, access differences, education content, and subscription-dependent options needed consistent places in the interface. Review notes carried those decisions into subsequent design revisions.
The process
How the work came together.
Separate the reporting views
Distinguish roster comparison, player detail, daily/weekly views, and report generation.
Specify interface controls
Account for dates, players, positions, and report-dependent filters.
Refine across devices and roles
Extend the design to mobile layouts and organization or team administration.
Skills & applications
What the work called for.
- Power BI
- Embedded reporting was a dependency the interface design had to accommodate.
- Responsive analytics portal
- Navigation and controls organize access to team and player information.
- Organization & team settings
- Administrative screens support the wider account experience.
The deliverables
What took shape.

UX & interface design
- Responsive analytics interface
- Roster, player & report navigation
- Organization & team management designs
The outcome
The result.
Interface designs and review notes that connect sports reporting, navigation, and administration, with a clear handoff for the Power BI and development work.