Measures with a shared meaning
Agree on KPI definitions, source records, time periods, and ownership so people can interpret the same number the same way.
Dashboards, reporting & insights
A report can be full of numbers and still leave the reader unsure what to do. I build dashboards and reporting workflows around the questions your team needs to answer.
Work with me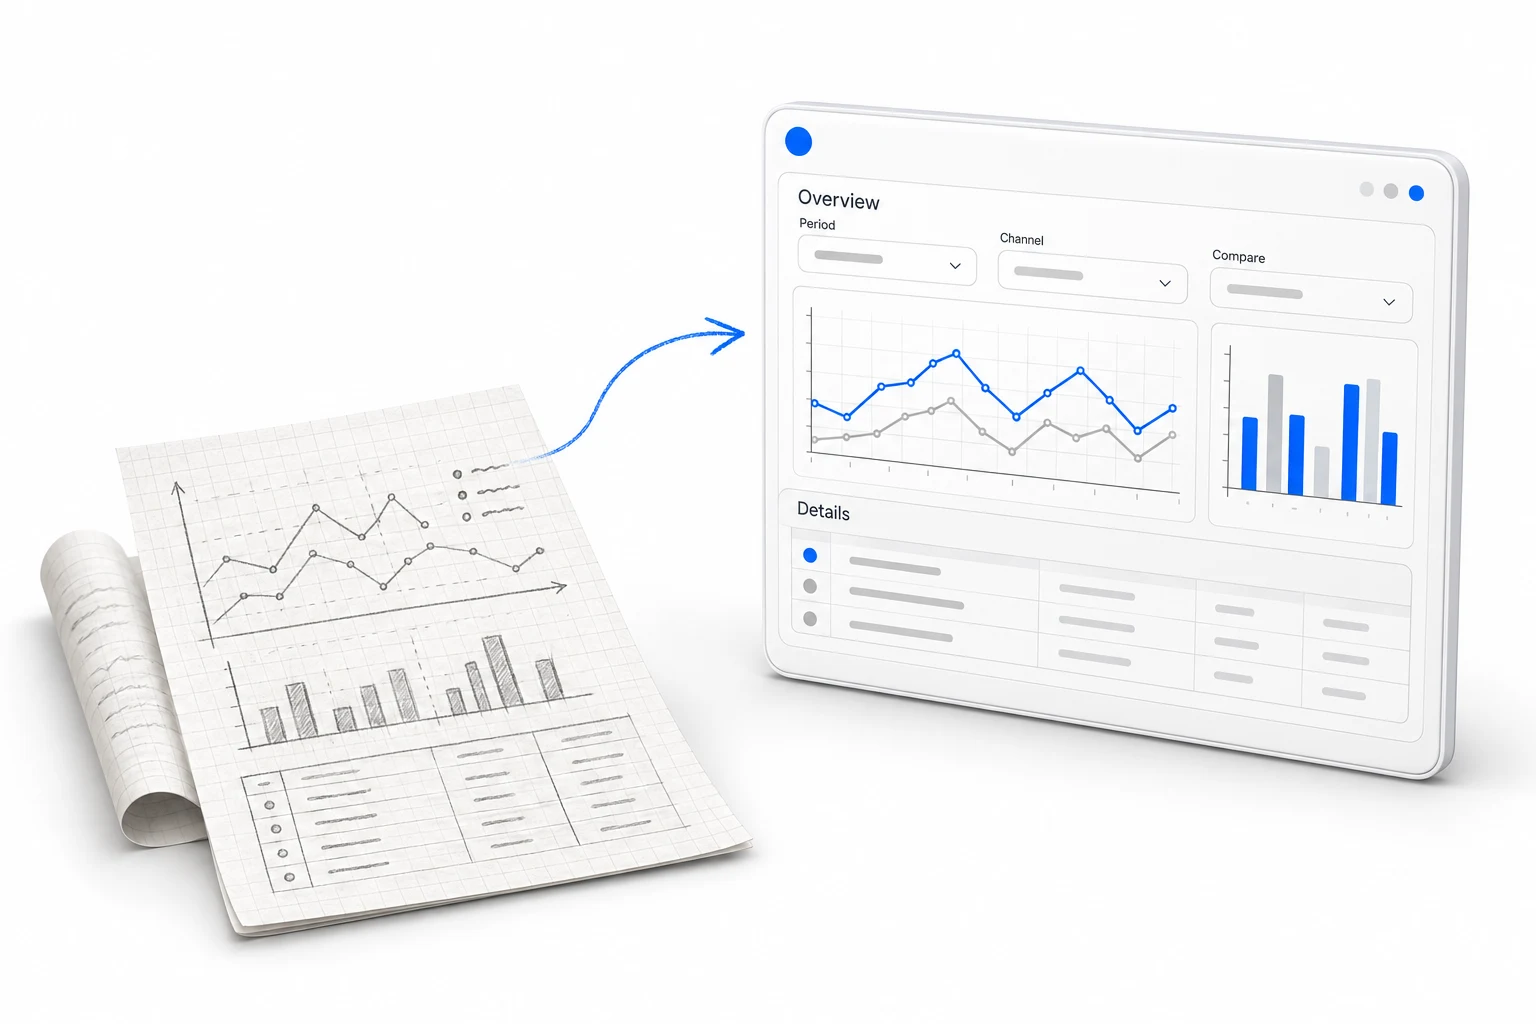 Sketch the idea. Build the useful thing.
What we can make
The audience and decision shape the view. A campaign review needs a different level of detail from a daily operations check. We define the measures, reporting period, and comparisons before choosing charts, then check whether the available data can support the story.
Agree on KPI definitions, source records, time periods, and ownership so people can interpret the same number the same way.
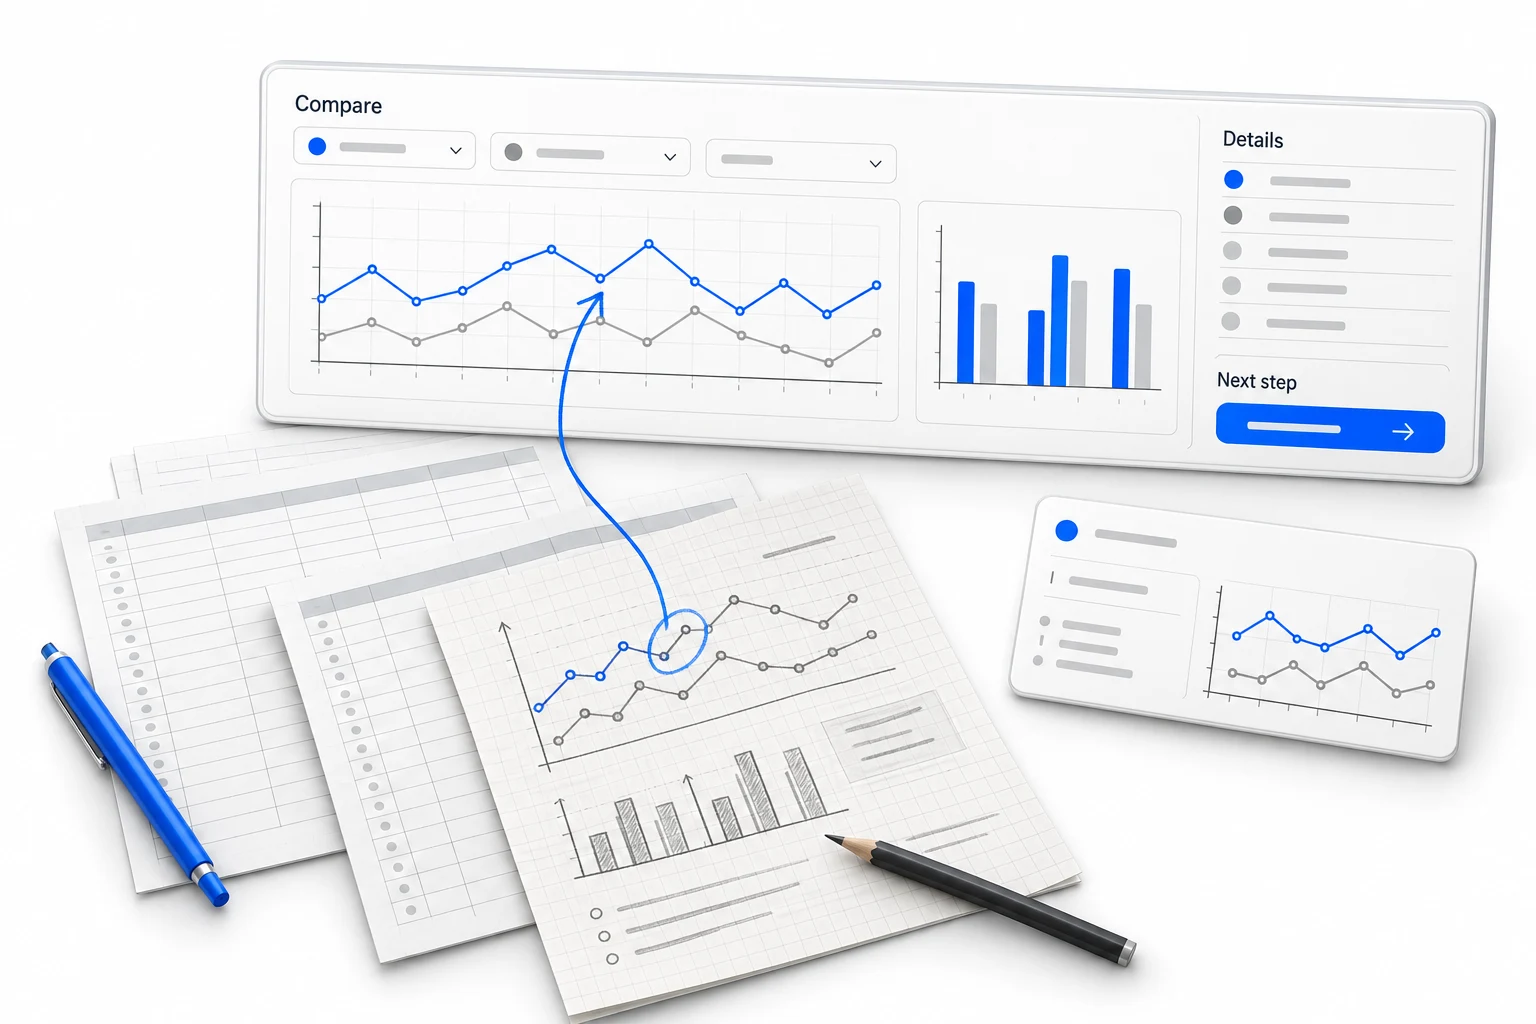
Create a hierarchy of performance, exceptions, and detail that helps the reader find what needs attention without opening every underlying record.
Connect or organize the reporting steps, document refresh expectations, and make missing or delayed data visible where it matters.
How I approach it
We work backward from the business question to the data required to answer it. I review the structure and definitions, build a useful first view, and refine it with the people who will read it. The handoff includes what the measures mean and where the data has limits. My experience includes campaign reporting and operational systems.
Fiscal-year reporting and master dashboardsBefore we begin
We identify the gaps before treating the report as a reliable source. Some questions can be answered with clear qualifications; others need changes to collection or record structure first. The dashboard should make uncertainty visible rather than imply a level of precision the source cannot support.
Bring a report people use, a sample of its source records, and a question it should answer. We clarify what each measure counts, the reporting period, and which comparisons the available data can support.
We agree how often the report needs to update, how the data will reach it, and who checks a failed or late refresh. The view should make missing information and its last update visible.
We reconcile the reported figures with source records and work through a representative business question. The review checks whether the reader can find an exception, understand the measure, and decide what needs attention.
Connected work