Products / A distributor back-office experience
Make complex performance information easier to follow.
Dashboard and reporting-interface design for a distributor back office.
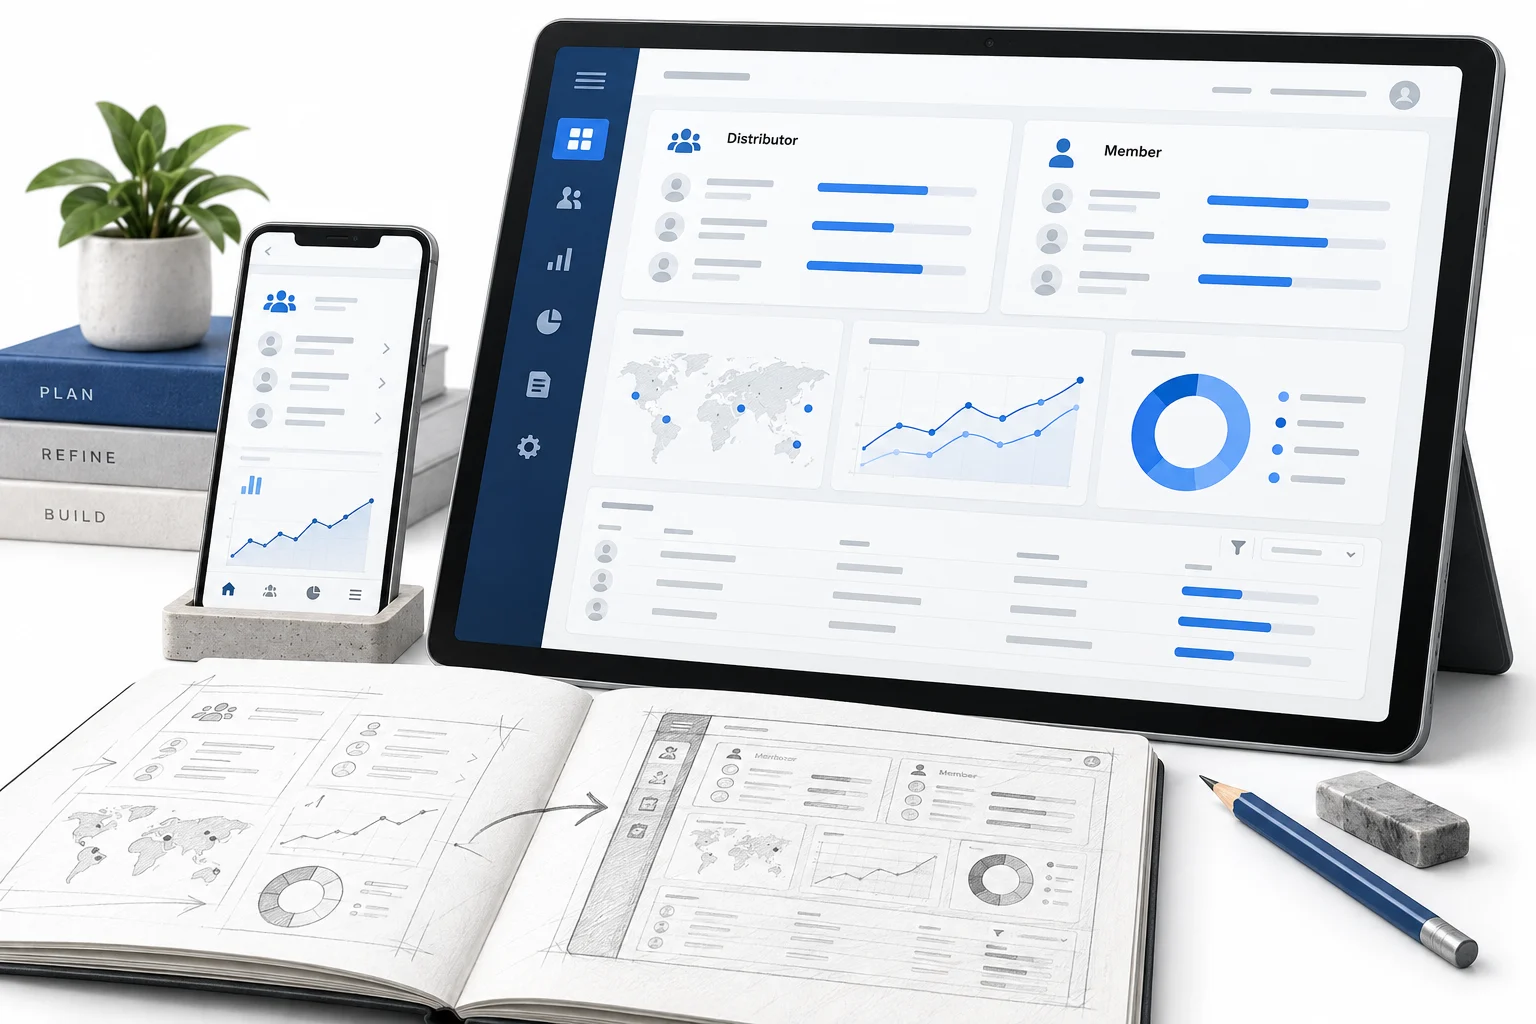
Performance information
Wireframes & hierarchy
Interface refinement
Reviewed dashboard designs
Organize the different views of performance.
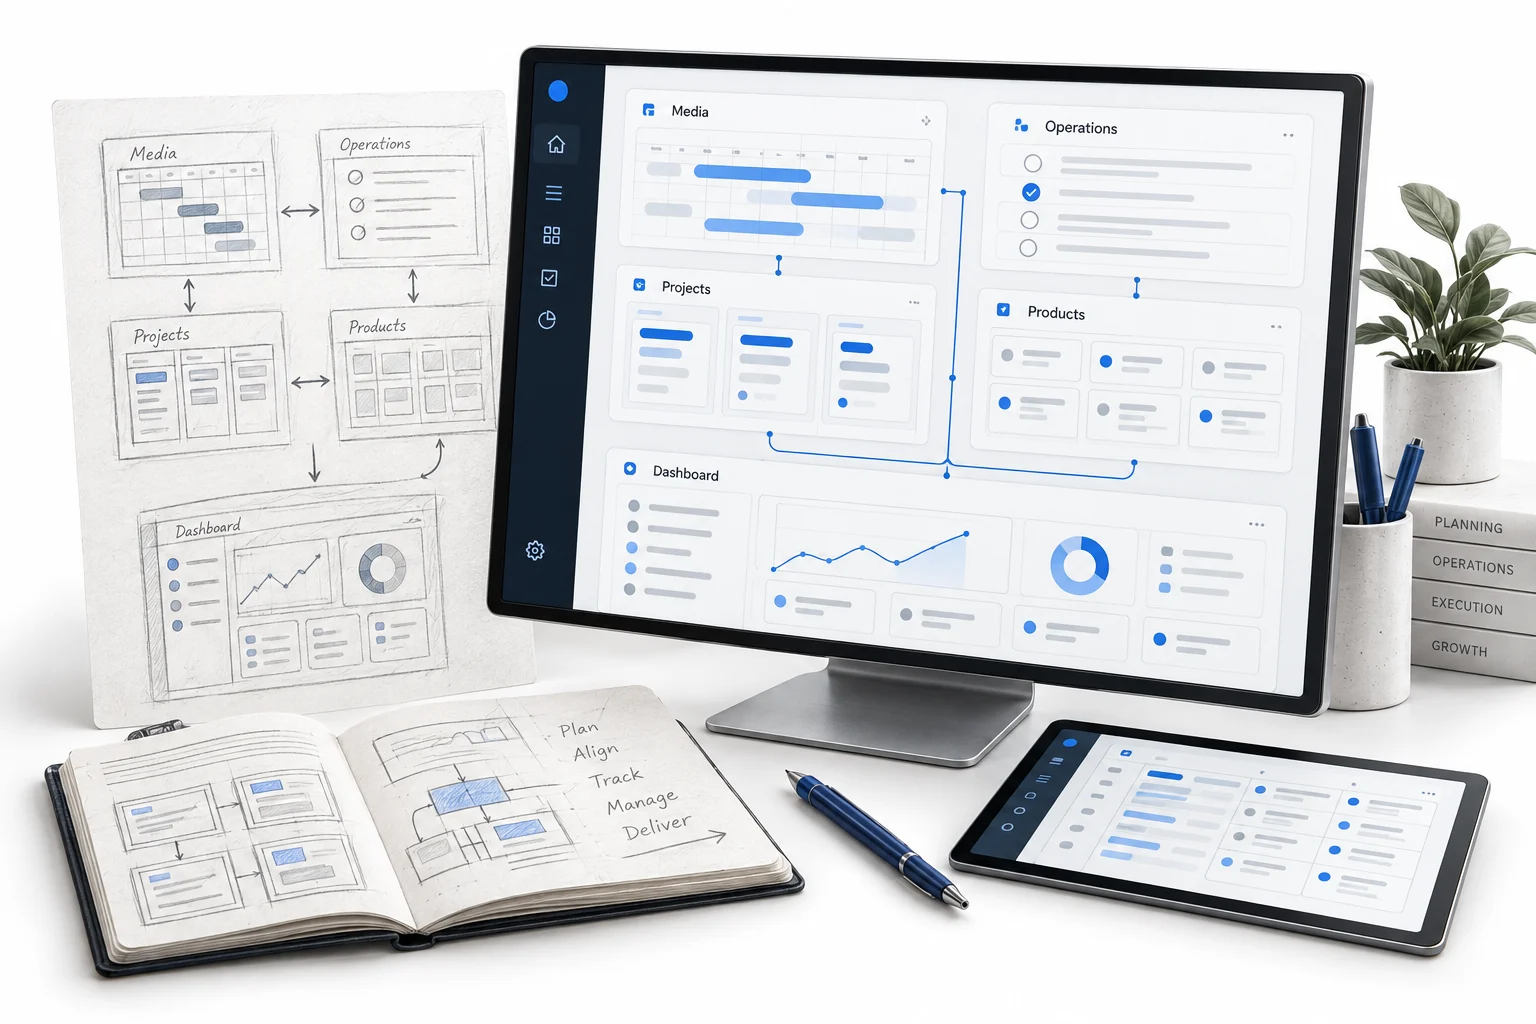
The design work covered period-based overviews, performance forecasts, calculation views, and dashboard content. Each view needed a clear hierarchy so that a person could understand which period and information they were looking at.
Connect the detail with everyday tools.
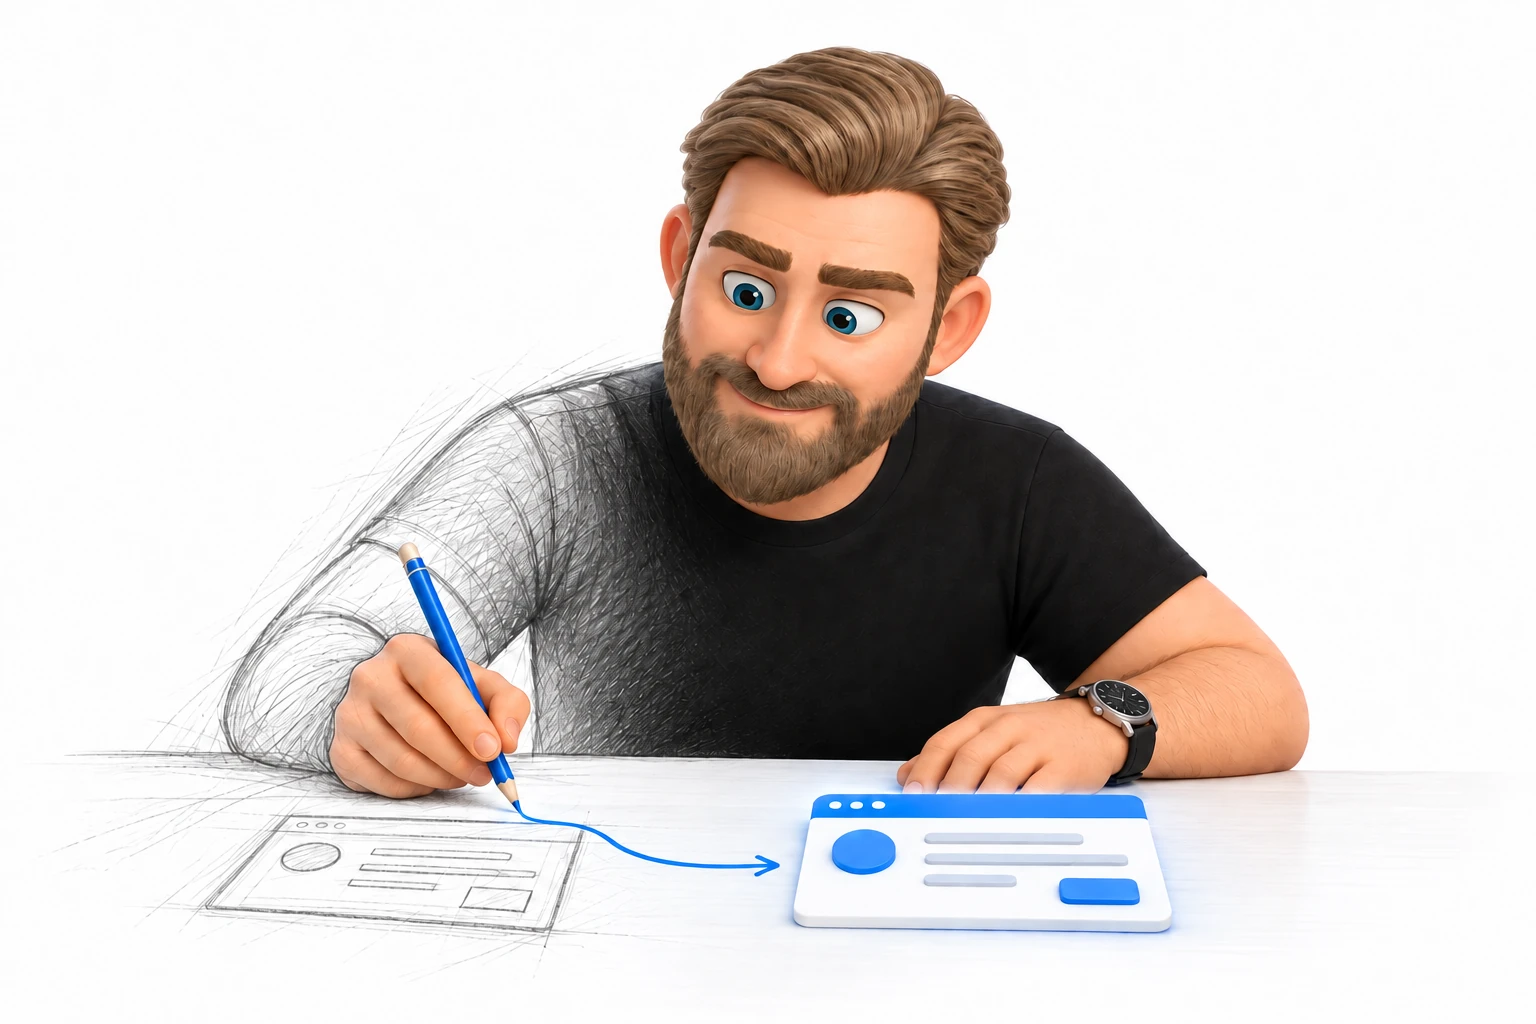
Dashboard concepts brought together quick tools, news, and account information. Other screens explored tables and current-versus-rolling-period views. The work included research, wireframing, design, and repeated refinements to spacing and alignment.
Make review part of the process.
The project records include a client review of the back-office designs and approval to move forward. This case covers that design contribution. The reporting interface does not imply that I authored the underlying compensation formulas or business rules.
The process
How the work came together.
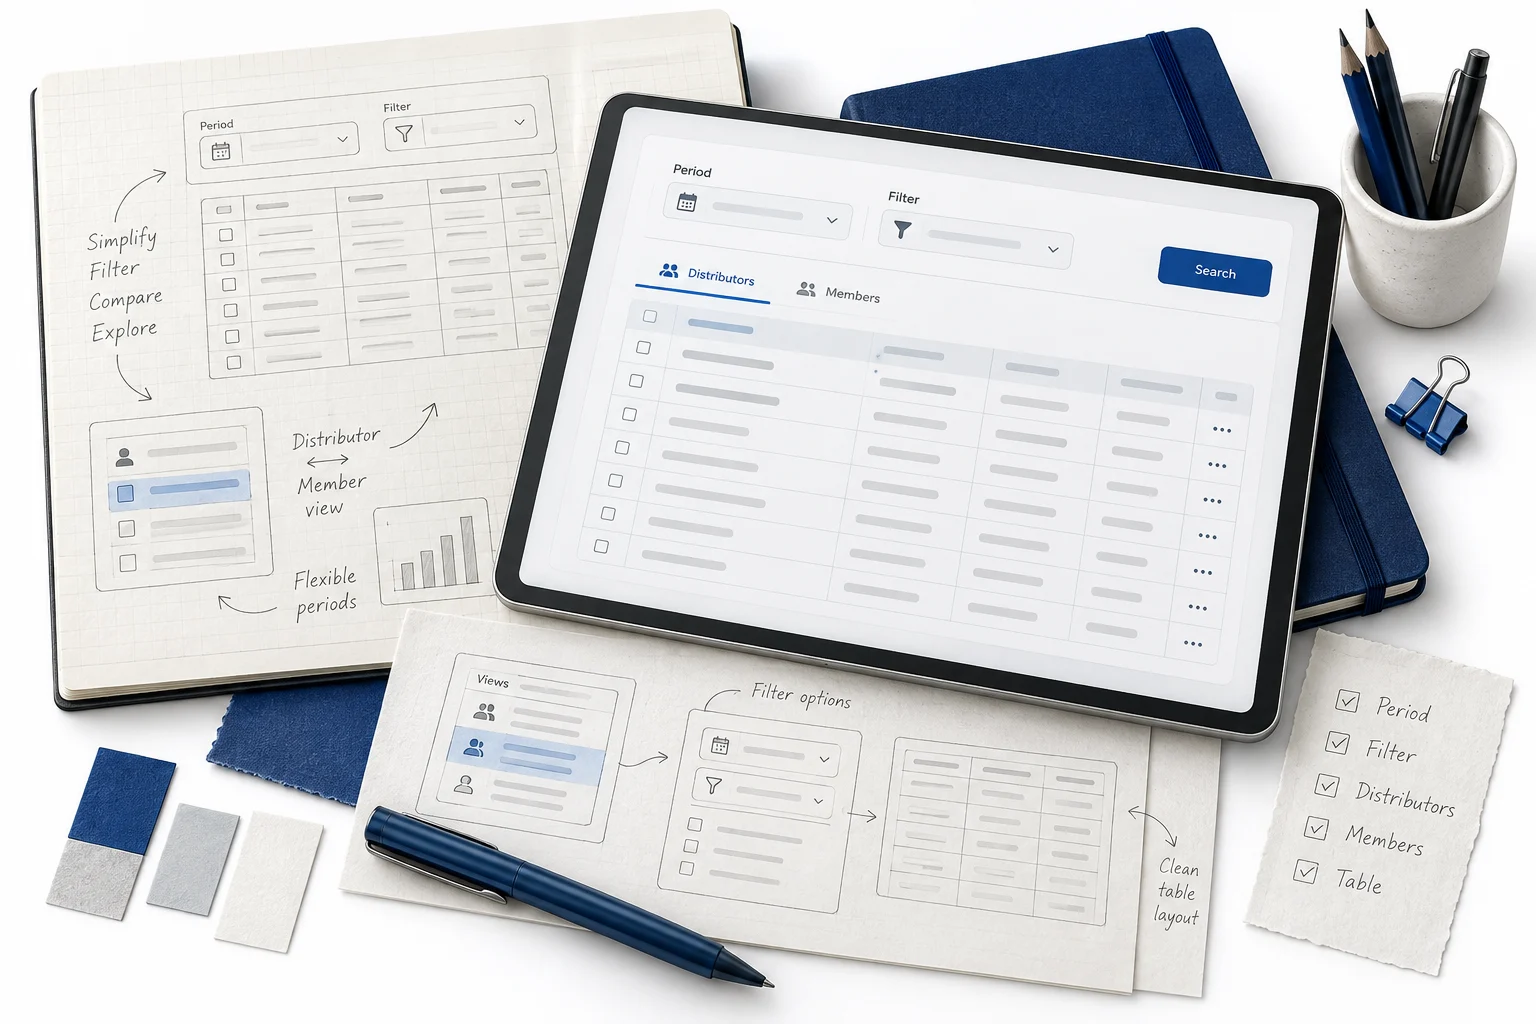
Structure the performance views
Work through periods, overviews, calculation displays, and forecasts.
Design the dashboard experience
Connect detailed reporting with quick tools, news, and account information.
Review and refine
Use client feedback and layout adjustments to prepare designs for the next phase.
Skills & applications
What the work called for.
- Back-office dashboards
- Designed views organize performance and account information.
- Period & forecast interfaces
- Current and rolling periods need explicit labels and clear visual hierarchy.
- Tables & quick tools
- Supporting screens connect detailed data with common actions.
The deliverables
What took shape.
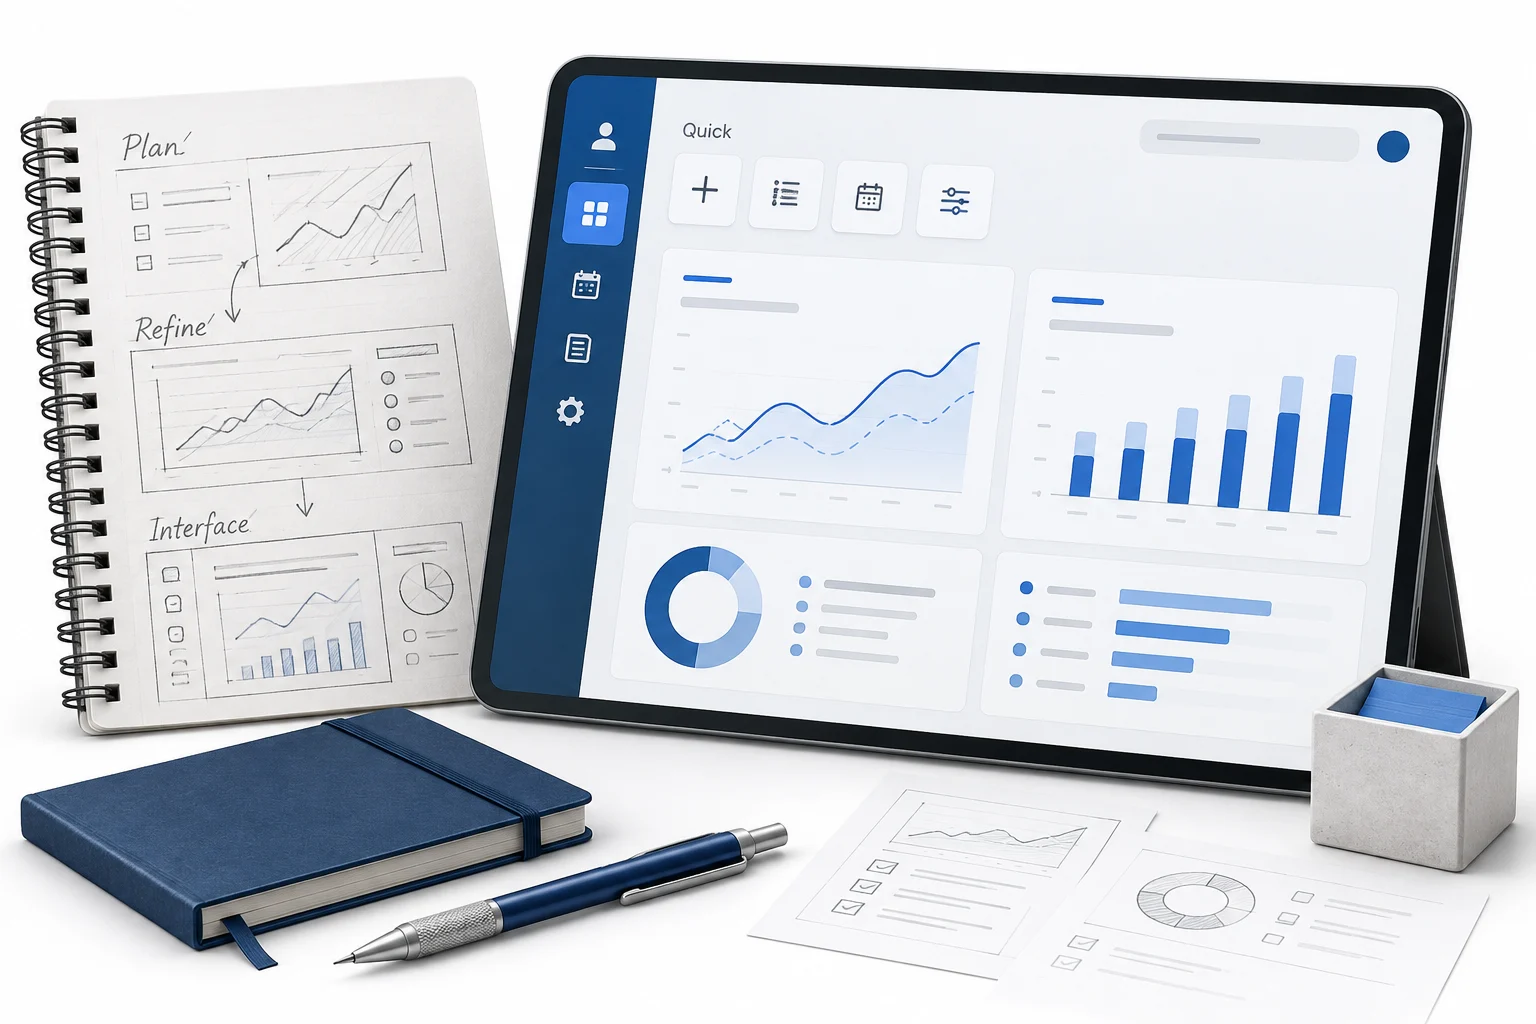
Back-office UX & interface design
- Performance & period-based views
- Dashboard tools & information hierarchy
- Reviewed back-office designs
The outcome
The result.
A body of reviewed dashboard and reporting designs that make the back-office experience concrete for further development.